Gantt Chart App for Apple Devices: Mac, iPad, and iPhone

Quick Look:
- Not all Gantt apps are the same — the difference between a timeline picture and a real project schedule matters
- Dependencies, hierarchy, milestones, and critical path turn bars into a working schedule model
- QuickPlanX is a native Gantt app for Mac, iPad, and iPhone with one subscription and iCloud sync
- Plan on Mac with keyboard and pointer precision; review and update on iPad and iPhone
- Export Gantt charts as PDF, image, or CSV for sharing and reporting
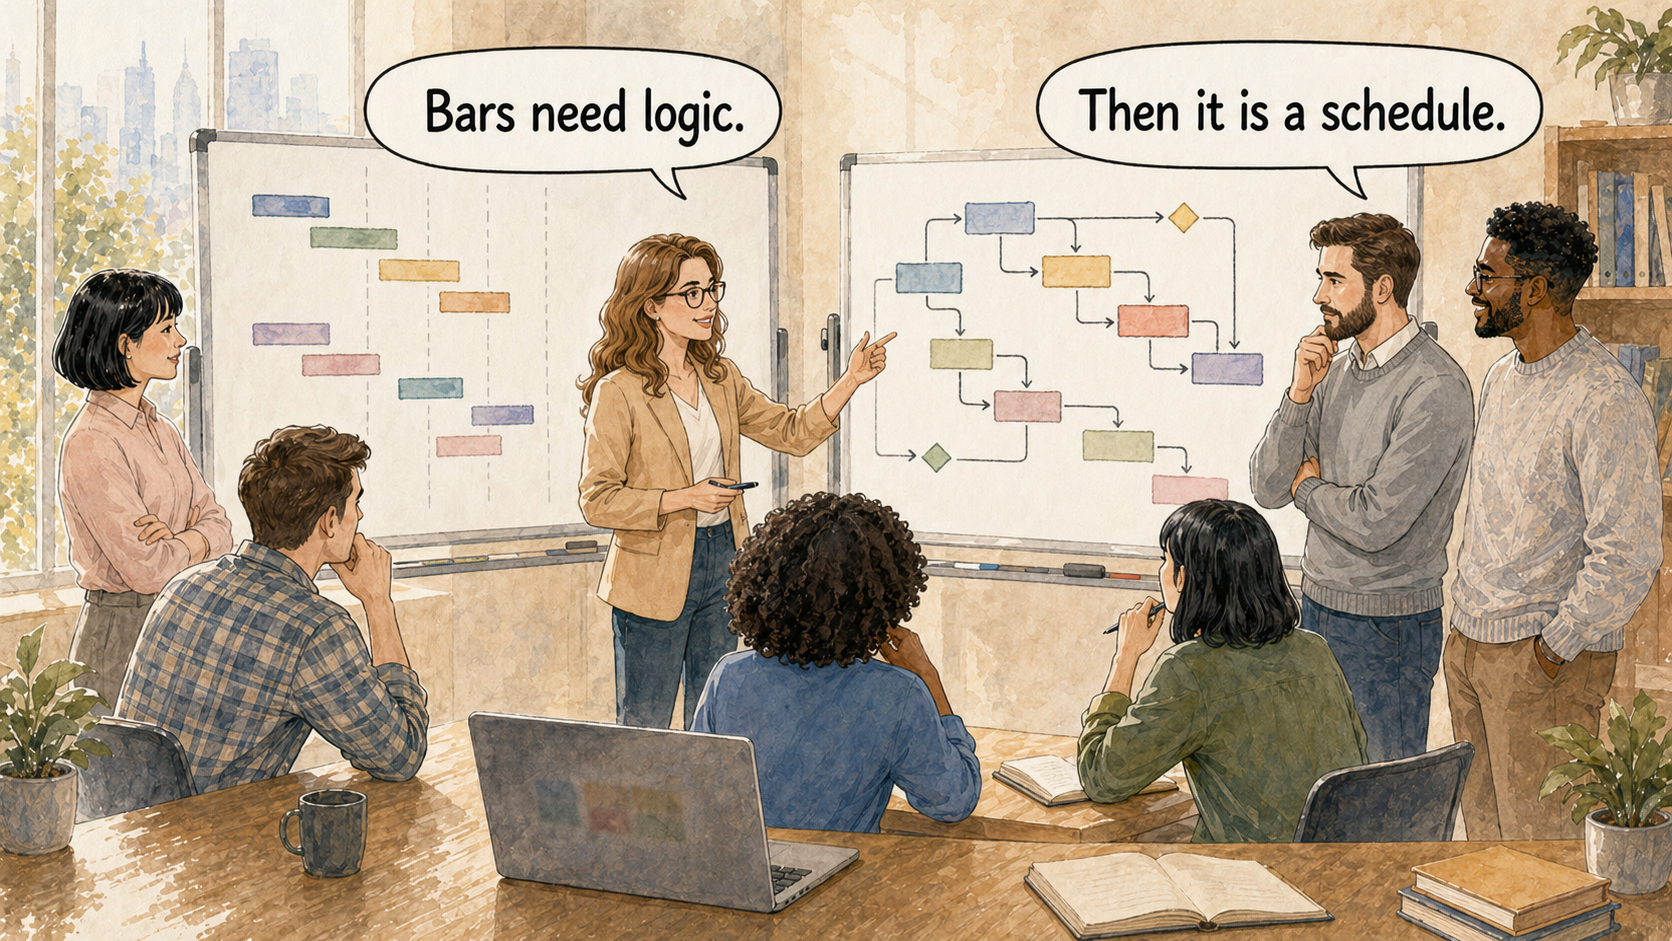
A Gantt chart is only useful when the bars mean something. If moving one bar automatically tells you what else needs to move, you have a schedule. If each bar is independent, you have a picture.
Most people searching for a Gantt chart app for Mac or iPad are not looking for a drawing tool. They want to build real project schedules: tasks with durations, phases with dependencies, critical paths that show where delays will hurt, and milestones that mark the moments that matter. This article explains what to look for in a Gantt app for Apple devices — and how QuickPlanX delivers on each of those criteria.
Real Schedules, Not Just Timeline Drawings
There is a common confusion in the Gantt chart app market. Some tools let you draw horizontal bars on a timeline and call the result a Gantt chart. That is a good visual aid for a presentation, but it is not a project schedule.
A real project schedule has structure:
- Task hierarchy — work is organized into phases, work packages, and summary tasks. A summary bar automatically reflects the earliest start and latest finish of its children.
- Task dependencies — when one task must finish before another can start, that relationship is recorded. If the first task slips, the app can show you what is now at risk.
- Durations and calendars — each task has a duration, and the schedule knows which days are working days. Moving a five-day task by one day means one working day, not one calendar day.
- Milestones — specific dates that mark deliverables, reviews, or checkpoints. Milestones have zero duration; their purpose is to mark a moment, not a span of time.
- Critical path — the sequence of dependent tasks that determines the project's earliest possible finish. Understanding the critical path tells you where you cannot afford any delays.
QuickPlanX supports all of these. It is designed around the idea that a Gantt chart should reflect a real project model — not just a visual summary of what you already know.
For more background on what makes a project schedule real, see What a Project Schedule Is.
What to Look For in a Gantt Chart App for Mac and iPad
Before evaluating any specific app, it helps to know which capabilities actually matter for professional project work. Here are the criteria worth checking:
Task Hierarchy and Work Breakdown Structure
A project rarely consists of a flat list of tasks. Real projects have phases, sub-phases, and deliverables — and a good Gantt app should reflect that. Look for unlimited hierarchy depth, the ability to collapse and expand branches, and summary tasks that roll up dates and progress automatically.
Dependency Management
Dependencies define the logic of the schedule. Finish-to-start is the most common: Task B cannot start until Task A finishes. But a capable Gantt app should also support start-to-start, finish-to-finish, and start-to-finish relationships, plus lag time (a delay between two linked tasks) and lead time (overlap between two linked tasks).
In QuickPlanX, you create task links directly in the Gantt chart by dragging from one task bar to another — or by holding Fn on Mac and dragging. See Task Linking for details.
Milestones
Milestones are different from tasks — they have zero duration and represent a point in time rather than a span of work. Milestones need to be visually distinct from tasks, linkable to dependencies, and visible in reports.
Baseline and Progress Tracking
A baseline is a snapshot of the original schedule. As the project progresses, comparing actual dates against the baseline shows where the project is ahead, on track, or slipping. Without a baseline, the Gantt chart can only show where the project is now — not how far it has drifted from the original plan.
Reports and Sharing
A Gantt chart is also a communication tool. The ability to export the schedule as a PDF for a stakeholder meeting, an image for a slide deck, or a CSV for budget analysis determines how well the schedule can leave the app and reach the people who need it.
QuickPlanX produces PDF, image, CSV, S-Curve chart, resource, milestone, and text reports from the live project data — without reformatting or copy-pasting.
Dependencies and Critical Path: Where the Schedule Logic Lives

Dependencies are the most important feature that separates a drawing tool from a scheduling tool — and also the one most often underimplemented.
In QuickPlanX, linking tasks in the Gantt chart is a direct interaction: hold Fn on Mac and drag from one task to another to create a finish-to-start link. The linked tasks are visually connected by an arrow in the Gantt bar area. If you move the predecessor, the arrow shows the relationship clearly. If you choose to have the successor date automatically adjust, the schedule updates to respect the new timing.
This matters in practice. A project manager who links Task A → Task B → Task C can see immediately that a delay on Task A has downstream consequences. Without links, each bar is an island.
Critical path calculation builds on dependencies: it identifies the longest chain of linked tasks in the project, which determines the project's earliest finish. Any delay on a critical-path task is a delay to the whole project. QuickPlanX highlights the critical path so you know where the schedule cannot absorb any slip.
For a technical overview of task linking, see Task Linking.
Gantt Chart Views and Table View: Two Angles on the Same Schedule
QuickPlanX gives you four views of the same project: Table, Gantt Chart, Tree, and Column. These are not separate modes — they are different angles on the same underlying project model.
The Gantt Chart shows the schedule visually: bars on a timeline, arrows for dependencies, milestones as diamond markers, and progress fill inside each bar. It is the right view for schedule review, dependency management, and communication.
The Table View shows the same project as a focused spreadsheet — task names, durations, start dates, finish dates, predecessors, successors, resources, progress, and any custom fields you have added. It is the right view for bulk editing, date updates, and field management.
The Tree View is best for building and reorganizing task hierarchy: drag branches to restructure, see the work breakdown at a glance, and build the outline before committing to dates.
Switching between these views does not change the project. It changes the lens. When you are scheduling, use the Gantt. When you are entering data across many tasks, use the Table. When you are restructuring, use the Tree.
This is covered in more depth in Easy and Smart Project Planning.
Plan Across Mac, iPad, and iPhone

A Gantt chart app for Apple devices needs to feel right on each device — not just run on all of them.
Mac is where most serious Gantt work happens. QuickPlanX on Mac supports keyboard shortcuts for date adjustments, duration changes, task insertion, linking, and duplication. The toolbar is customizable. The Gantt and Table views have room for dense project information. Fn + drag is the fastest way to link tasks. Mac is the right environment for building, scheduling, and reviewing a complex plan.
iPad brings the schedule into meetings, field visits, and planning conversations. The touch interface works well for Gantt review, task selection, and quick updates. The action bar surfaces the most relevant task operations without requiring a menu. iPad is comfortable for any planning session where you need to move, present, or discuss.
iPhone keeps the project close. It is best for checking today's work, updating progress on a specific task, or reviewing the schedule between other work. In-progress task widgets can surface active tasks on the Home Screen or Lock Screen so you do not need to open the app every time.
Because QuickPlanX is a universal app, one subscription covers all three platforms. The project data is the same on all devices, kept in sync by Apple's CloudKit. A plan built on Mac is available on iPad and iPhone without file transfers or manual export.
See One App for iPhone, iPad, and Mac for more detail on the cross-device experience.
How to Evaluate a Gantt App Without Getting Lost in Feature Lists
Gantt chart apps often compete on feature counts. A long list of supported capabilities is not the same as a well-designed planning tool. When evaluating an app, focus on a few practical questions:
Can you build a real schedule in under an hour? If setting up dependencies and hierarchy requires a complex workflow, the app will slow down every project from day one. QuickPlanX supports bulk text input to create task hierarchy quickly, and Fn + drag to link tasks without leaving the Gantt view.
Will you keep the plan updated? The most important project management habit is keeping the schedule current. If updating the plan feels expensive — too many clicks, too slow, too awkward on iPad — it will not get done. QuickPlanX is built around this: editing in the Table View, drag-and-drop restructuring, and spreadsheet copy-paste all reduce the cost of keeping the schedule accurate. Fast project planning covers these workflows in detail.
Can the plan communicate to others? A project schedule that lives only inside the app is a private artifact. The ability to export a clear Gantt chart as PDF, share milestones as a focused report, or export data to CSV determines how well the plan can become a shared tool for the project.
Does it feel native on Apple devices? An app that feels like a web app wrapped for Mac or a Windows port adapted for iPad will never feel comfortable in the Apple workflow. QuickPlanX is built natively for Apple platforms — keyboard shortcuts, menus, touch interactions, CloudKit sync, and widgets all follow the conventions you already know.
QuickPlanX: A Professional Gantt Chart App for Apple
QuickPlanX is a professional Gantt chart app designed specifically for Apple devices. It is not a simplified version of a desktop tool, and it is not a to-do list with timeline bars. It is a project scheduling app built for people who need to create real schedules, maintain them through change, and share them with clarity.
The Gantt chart is the primary scheduling view, paired with Table, Tree, and Column views for different stages of planning work. Task links, milestones, baseline comparison, and critical path are built into the scheduling model, not added as premium features. Reports cover the formats that project communication actually requires.
If you are looking for a Gantt chart app for Mac, iPad, or iPhone — and you want a schedule that reflects real project logic rather than a visual timeline — QuickPlanX is built for that work.
Ready to try QuickPlanX?
![]()
Related articles: Easy and Smart Project Planning · Plan at Remarkable Speed · One App for iPhone, iPad, and Mac · Share Clear Project Reports