Customize Grid Lines in Gantt View
QuickPlanX provides display settings to customize vertical grid lines and column backgrounds in the Gantt chart's Day View. These options help you maintain visual orientation across multi-week schedules and clearly distinguish calendar weekends that are configured as active working days.
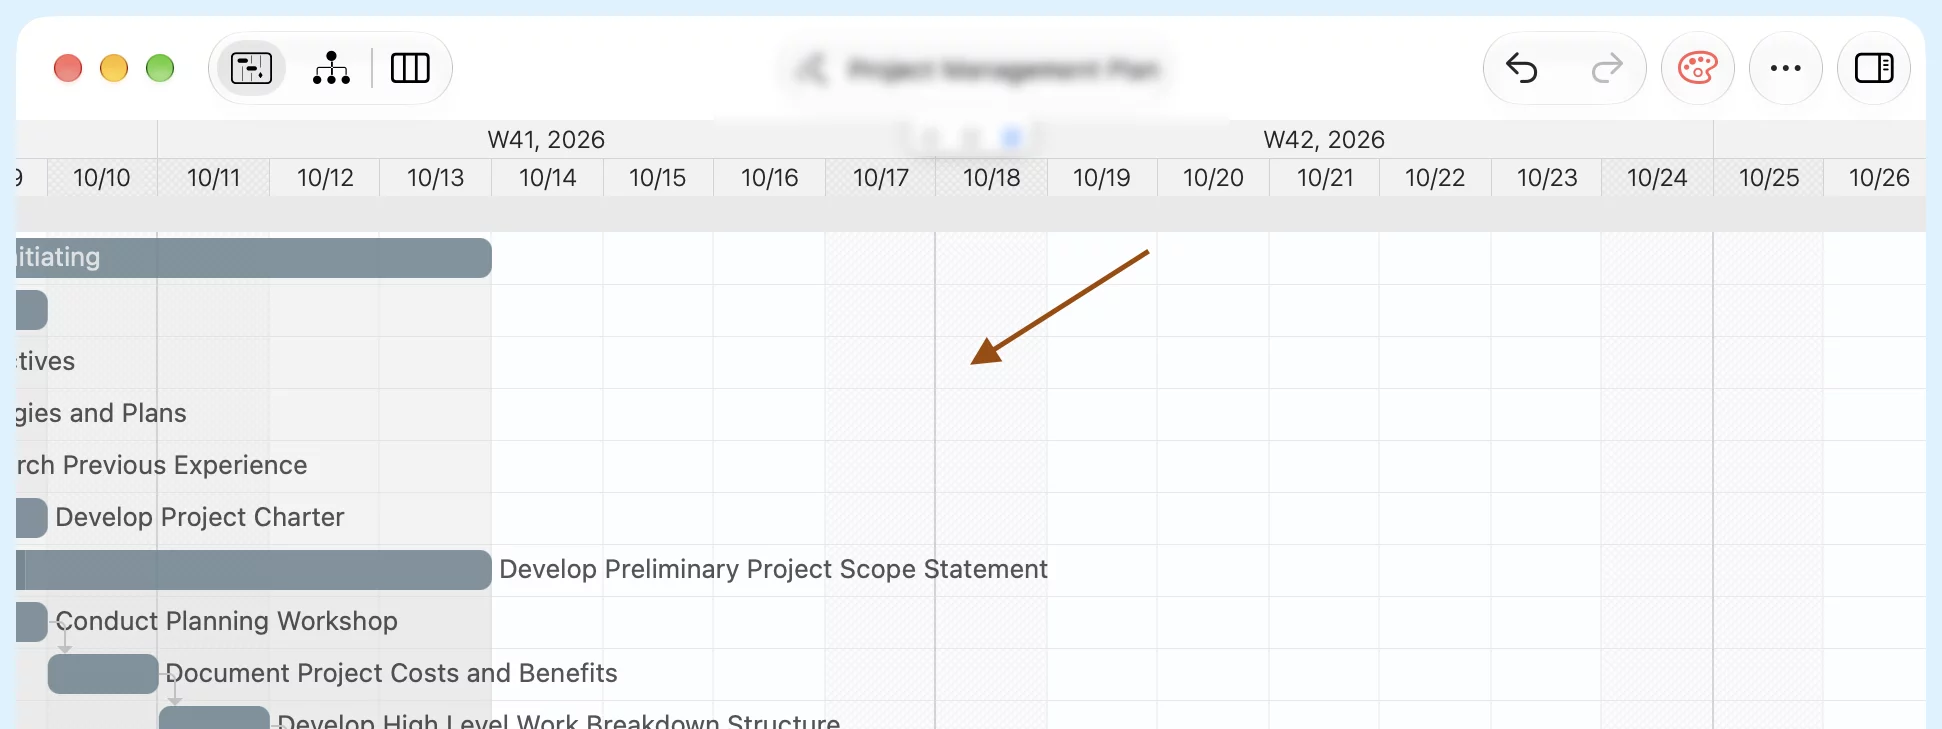
Grid Line Display Options
The Grid Lines in Gantt View section includes two independent display options for Day View:
1. Week & Month Boundaries in Day View
Controls the visual emphasis of vertical grid lines marking the start of each week and month.
- Normal (default): Uses uniform, light vertical lines across all days.
- Bold: Draws darker, more prominent vertical divider lines at the beginning of each week and month.
When to use Bold: In long-running or densely packed project schedules, uniform daily grid lines can make it difficult to determine where weeks and months begin without scanning up to the timeline header. Setting boundaries to Bold establishes clear visual anchors across the chart canvas, helping you track weekly cadence and monthly milestones at a glance while retaining day-level detail.
2. Weekend Cell Background in Day View
Controls background shading for Saturdays and Sundays when the project calendar treats weekends as working days.
- Same (default): Renders weekend working days with the same plain background as normal weekdays.
- Shaded: Applies a soft background tint to Saturday and Sunday columns, distinguishing them from Monday through Friday.
When to use Shaded: If your project operates on a 7-day work week (common in construction, field operations, events, and maintenance shutdowns), weekend dates are scheduled as working days. However, managing weekend work often involves unique operational considerations: site noise constraints, weekend subcontractor shifts, and overtime tracking. Enabling Shaded keeps weekend working days immediately recognizable across the timeline.
Shading weekend cells is strictly a visual aid for project tracking. It does not alter working-day status, working hours, task durations, calendar constraints, or critical path calculations. To change whether weekends are working days or non-working days for a project, adjust your Project Calendar.
Video Tutorial
Watch the video tutorial below for a step-by-step walkthrough on configuring week and month boundaries and weekend shading in Day View:
How to Configure
Grid line styles are application-wide preferences configured in App Settings under the User Interface tab. Changes apply automatically to all projects viewed on your device.
Step-by-Step Instructions
- Open App Settings and go to User Interface Settings.
- Locate the Grid Lines in Gantt View section. (You can also type
GanttorGraphicsinto the search bar at the top of settings to jump directly to this group). - Choose your preferred options:
- Week & Month Boundaries in Day View: Select Normal or Bold.
- Weekend Cell Background in Day View: Select Same or Shaded.
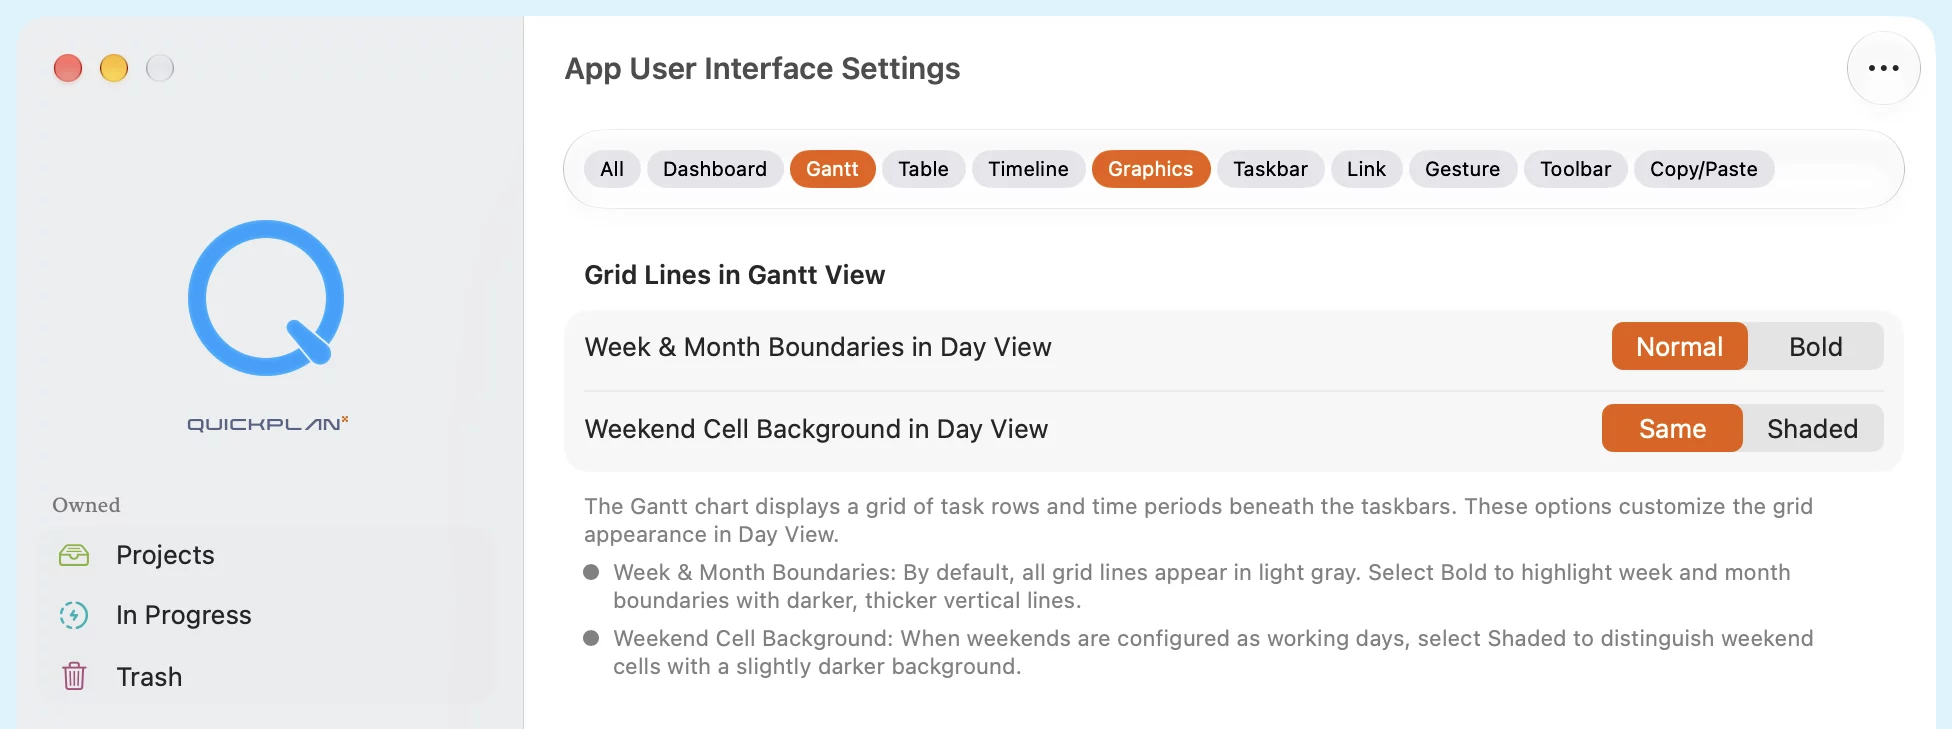
Settings take effect immediately on the open Gantt chart in the background. You can keep a project open, switch between options, and instantly preview which style suits your display and lighting conditions best.
Related Topics
- App Settings Overview — Learn about application-wide settings and how they differ from project settings.
- App Appearance — Explore other device-specific interface options including layout, colors, and gestures.
- Version 6.1 Announcement — Read the news release introducing the Day View grid line options.